In ACCORDION, we concluded that for the purpose of monitoring we will use Prometheus1i. Prometheus is a popular open-source system that can be used for minoring purpose. Prometheus uses a time series database to store metrics in a key-value pair format. It has its own query language named PromQL2. Prometheus has a pull model which basically pulls metrics from exporters. Exporters can fetch statistics from non-Prometheus systems and convert them into Prometheus metrics. We can find the metrics of an exporter at /metrics URL.
To pull metrics from the exporters Prometheus must know the targets through service discovery or static configuration. In order to create graphs, Grafana performs PromQL queries to Prometheus to get the appropriate results. Also, the Alert manager produces alerts by using PromQL with upper or lower limits.
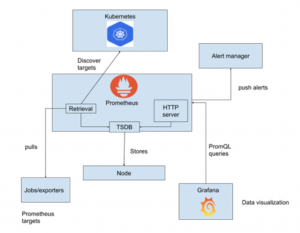
Figure 1 High-level architecture of the monitoring component.